In the “Visualizations” tab, I am able to see telemetry through a smoothened graph with 1 data point every hour. Is it possible to change the frequency at which data is collected? If the frequency is already higher, is it possible to change the sampling rate of the graphing tool on Visualizations tab?
Hi Nikhil,
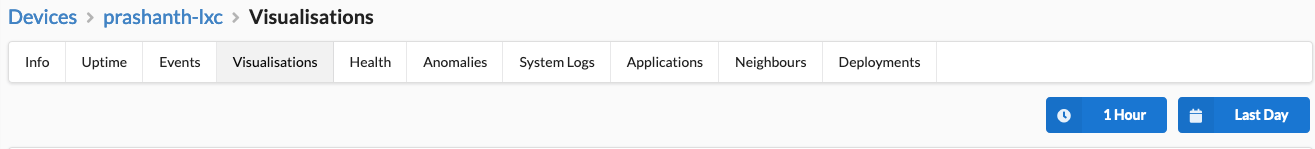
By default we collect telemetry every 3 minutes . This is configurable as an ENVIRONMENT variable on the server side but not really user configurable via UI . Just FYI if you want to see points higher than every 1 hour , you can adjust the dropdown from 1 hour to every 5 min on the top right column . Here’s a screenshot for reference :
1 Like
Thanks for that update @prashanth
Is there any way to set this frequency (3 minutes) in the client software (AiAgent)?
@nikhil, The recommended way is to do it via the server as a server configuration , however it is possible to edit some config files in the AiAgent side , but they could get overwritten on an AiAgent upgrade . I have sent you a direct message with the details , you can have a look and see if it makes sense to you!