I am creating a grafana panel on top of aikaan influx db gojek-controller.aikaan.io to monitor aikaan device health and provide alerting. I want to know which measurement provides the data from the list I want to track.
I have guess some measurement and fields I should read to track the events CMIIW.
Average CPU Usage
measurement: cpu
field: usage_user (is this percentage unit?)
Average Memory Usage
measurement: mem
field: used_percent
Internet Usage
measurement: net
field: bytes_recv (sum of bytes_recv over time period)
I still need help in identifying which measurement and fields for the below event.
Hardware Failure
Average Internet Speed
Average Network Uptime
Average App Uptime
Thanks
Hi @kelvinliu007,
Hardware Failure - there is no specific influx telemetry for this , unless you are using business_telemetry and found a way to detect a specific hardware failure . Although if you’re talking about the entire hardware going down , then the system telemetry should help
Average Internet Speed - this can be inferred from the net measurement using bytes_sent and bytes_recv , you’ll need to use influxql functions like non_negative_derivative to infer such parameters
Average Network Uptime - you can use the heartbeat measurement for this . A count of this over a timerange will help you infer if network was available at a particular time ( We get heartbeats only when there’s network )
Average App Uptime - you can use the procstat_lookup measurement for this . Use the field called running which will indicate if your app/process is running or not . A count of that over a time range will indicate uptime .
1 Like
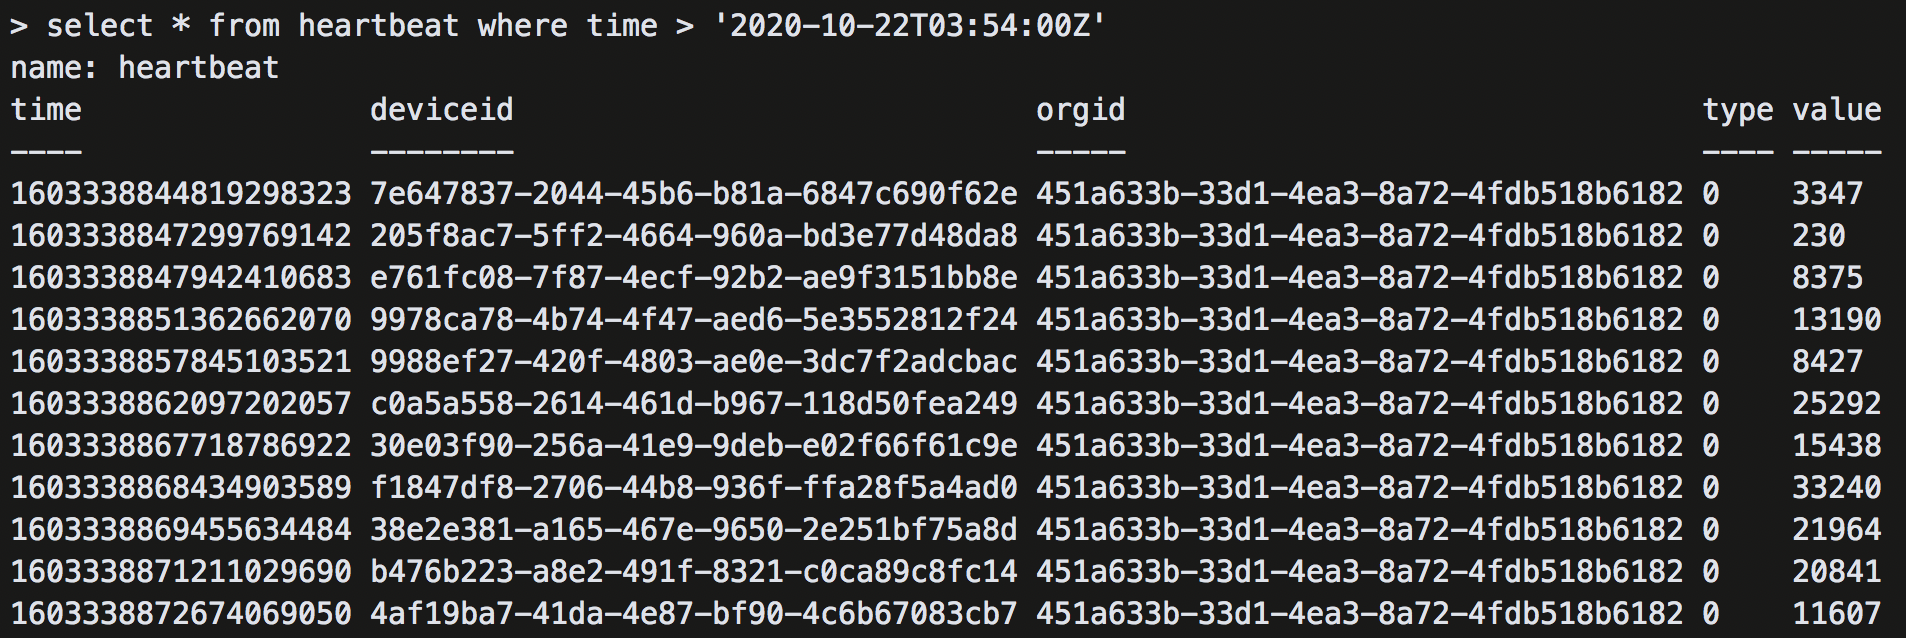
Hi @prashanth what does value means on heartbeat measurement?
Hi @kelvinliu007,
We don’t actively use value anymore so don’t depend on it . But just FYI, we used to use value as an device uptime tick counter which keeps incrementing every minute . This used to help us know how long a device was up even when there was no connectivity.
Hi @prashanth need some help in checking this query whether this is correct or not
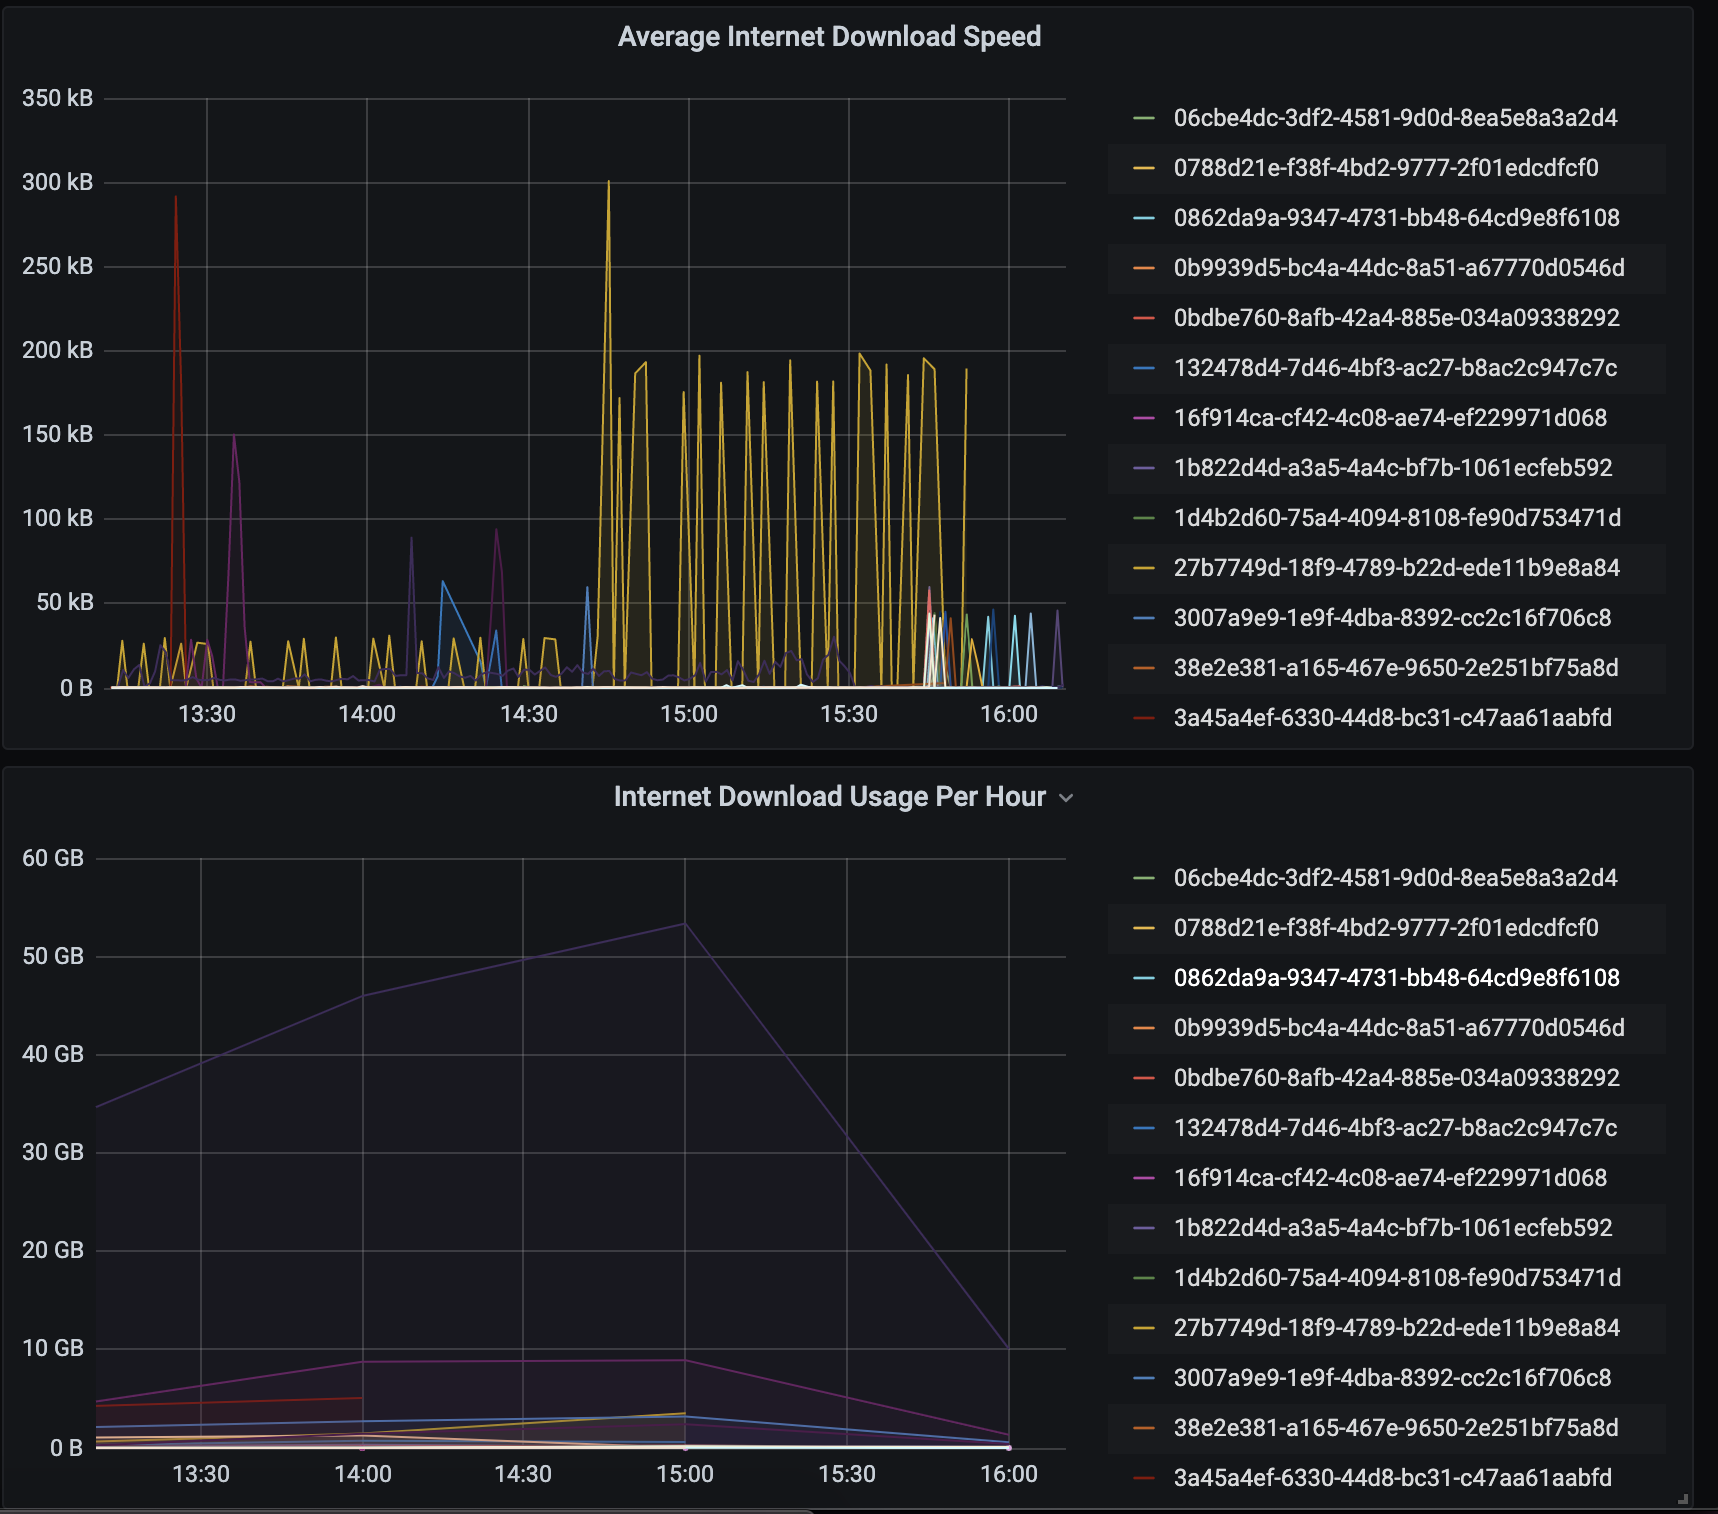
average internet download speed
SELECT non_negative_derivative(mean(bytes_recv), 1s) FROM “net” WHERE $timeFilter GROUP BY time(1s), “deviceid” fill(null)
internet download usage per hour
SELECT sum(bytes_recv) FROM “net” WHERE $timeFilter GROUP BY time(1h), “deviceid” fill(null)
I’m not sure the query is showing the correct results since the internet usage is over 40 GB.
Hi @kelvinliu007,
bytes_recv,bytes_sent are ever increasing numbers like ifconfig counters , so a sum() would not work. You need to use a combination of non_negative_difference and sum to get the consumption . Here’s what you could use (modify accordingly):
SELECT sum(download) from ( select non_negative_difference(bytes_recv) FROM “net” WHERE $timeFilter GROUP BY time(1h), “deviceid” fill(null) ) WHERE $timeFilter GROUP BY time(1h), “deviceid” fill(null ```
Hi @prashanth,
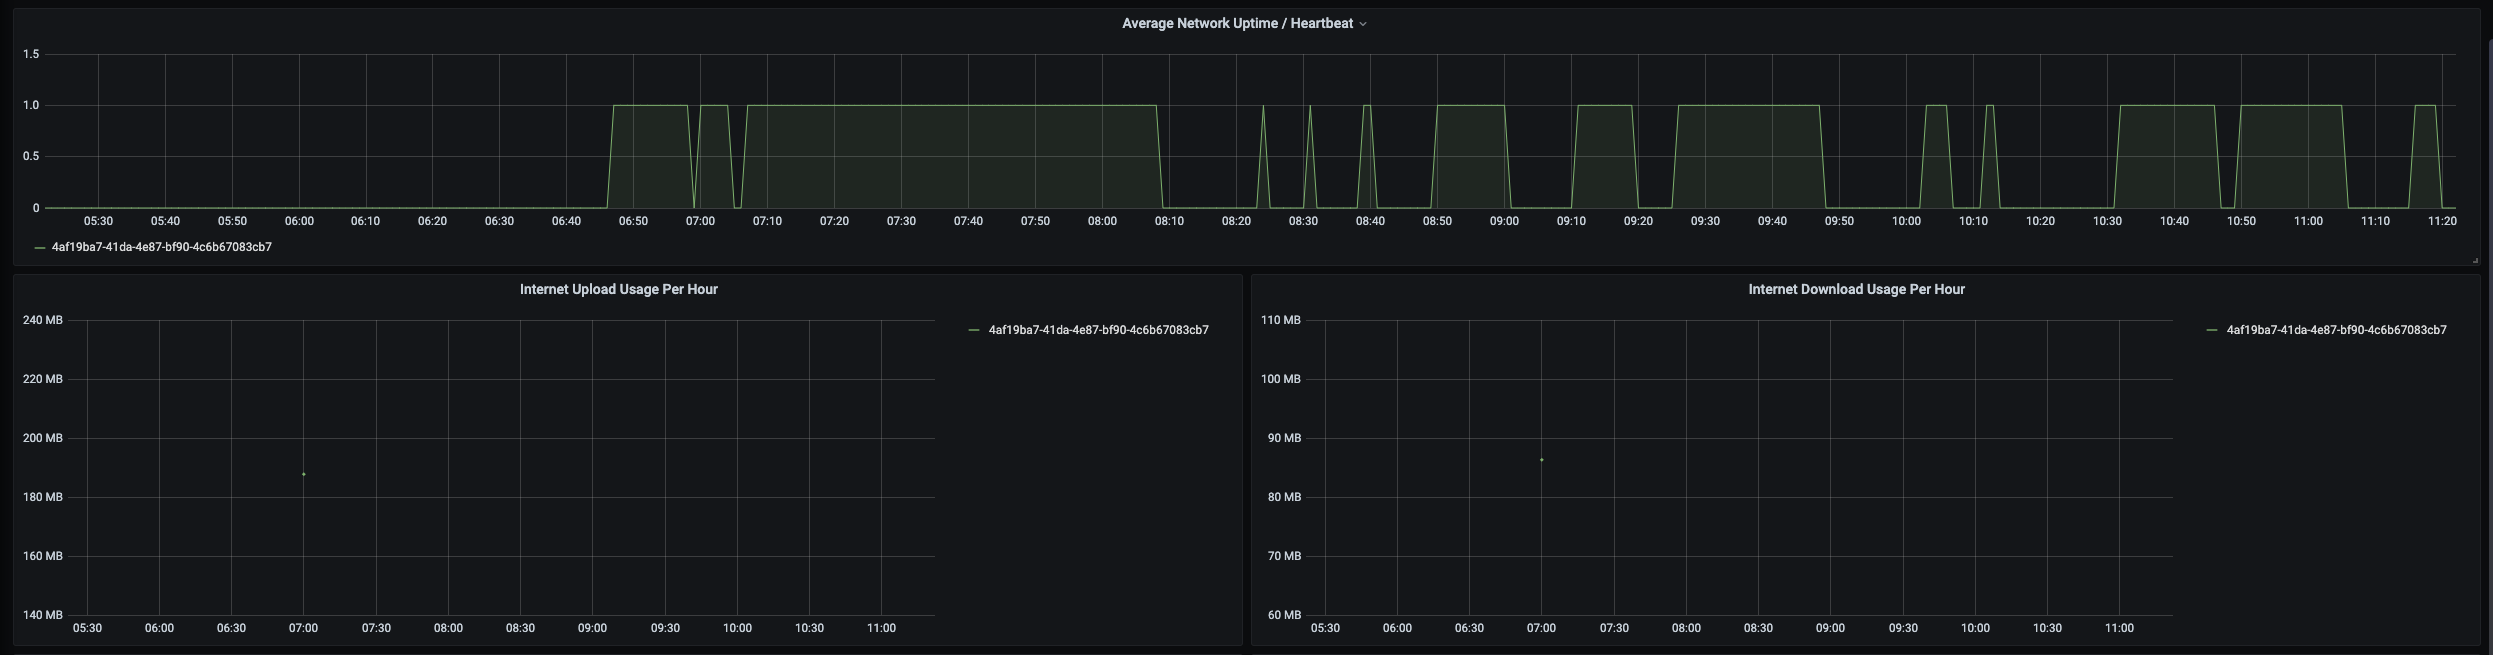
I have modify the query for internet download usage per hour into this
SELECT sum(download) from (select non_negative_difference(sum(bytes_recv)) as download FROM "net" WHERE $timeFilter AND "deviceid" =~ /^$device_id$/ GROUP BY time(1h), "deviceid" fill(null)) WHERE $timeFilter GROUP BY time(1h), "deviceid" fill(null)
seems to be working well, but is it normal for device not to show internet usage while it is sending heartbeat stats?
Also can we infer average internet download speed per hour from net measurement? do we just divide the total internet usage by 3600? or is there any other equivalent query for that?
Is there any measurement that track this event?
Hi @kelvinliu007,
you don’t need to do a non_negative_difference(sum(bytes_recv)) , you just have to do a non_negative_difference(bytes_recv) . Also you need to specify the interface (which is probably why you’re not seeing anything ) , the ‘net’ measurement will have a field/tag called “interface” , please filter the right interface (like eth0,wlan0 etc) so that you’re getting the values according to the interface you want.
Here’s a sample query for average network speed
SELECT time, non_negative_derivative(max(bytes_recv)) * 8 / (1024 * 1024 * 3600) as "download", non_negative_derivative(max(bytes_sent)) * 8 / (1024 * 1024 * 3600) as "upload" FROM net WHERE host='abc' AND ( interface = 'eth0' ) AND time > 1604293278000000000 and time < 1604379678000000000 GROUP BY time(1h);
Regarding the measurement to track the wlan1 event , I’d suggest you create a separate thread for that , I’m not sure how it is computed , I’ll get the right team to answer it for you!
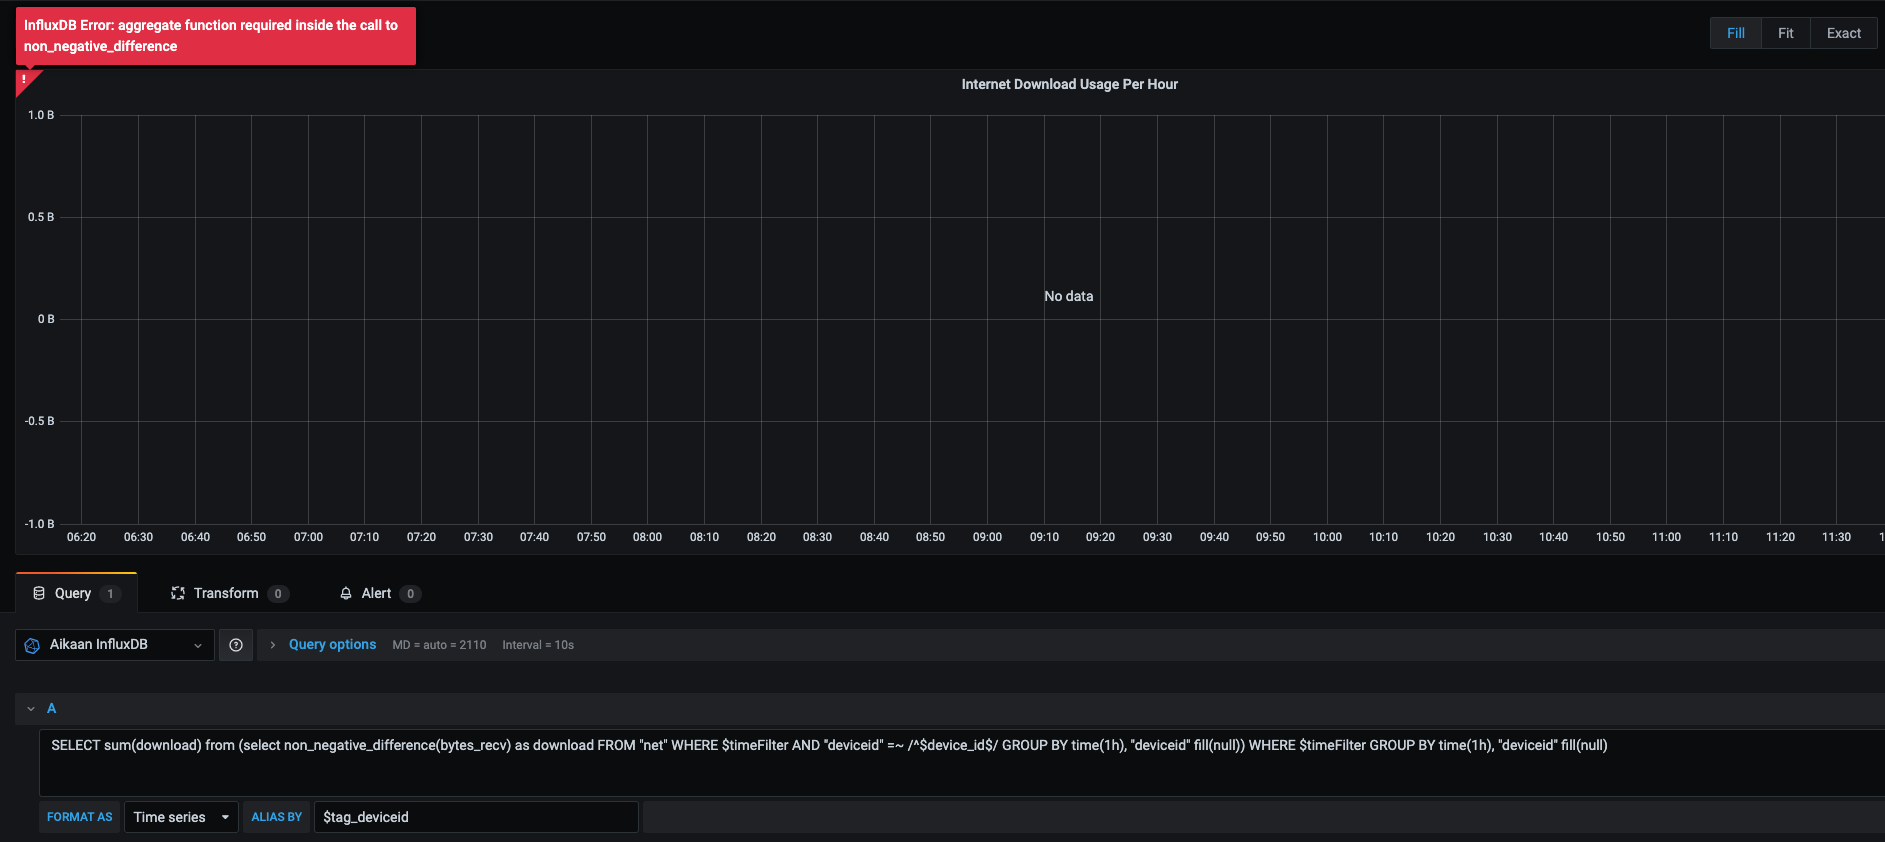
@prashanth If I remove the sum I’ll get this kind of error
@kelvinliu007 you don’t need to do a group by deviceid if you have it as a where filter. here’s a sample query we use ( modify accordingly )
select sum(download), sum(upload) from (select (non_negative_difference(bytes_recv)/(1024.0 * 1024.0)) as "download", (non_negative_difference(bytes_sent)/(1024.0 * 1024.0)) as "upload" from net where deviceid = '$deviceid' AND time >= $timestart and time <= $timeend and interface = 'eth0') where time >= $timestart and time <= $timeend GROUP BY time(3600s)